
This post is a follow-up to a March 1st 2024 report that presented the methodology and first-stage results of the U.S. Sub-National Innovation Index (SNII). The report discussed the process for designing a prototype regional innovation index based on the Global Innovation Index (GII), along with the results for a single Bureau of Economic Analysis (BEA) region.
The goal of this report was to show that, utilizing an indicator estimation approach, the GII could be condensed to a representative fraction of its total indicators, and that this representative sample could serve to guide the formulation of a regional innovation index.
In this report, the full results of the SNII are presented, which cover the following eight U.S. BEA regions: New England, Mideast, Southeast, Great Lakes, Plains, Southwest, Rocky Mountains, and the Far West (Figure 1). Data for the SNII is collected from a range of sources spanning from 2017 to 2023.
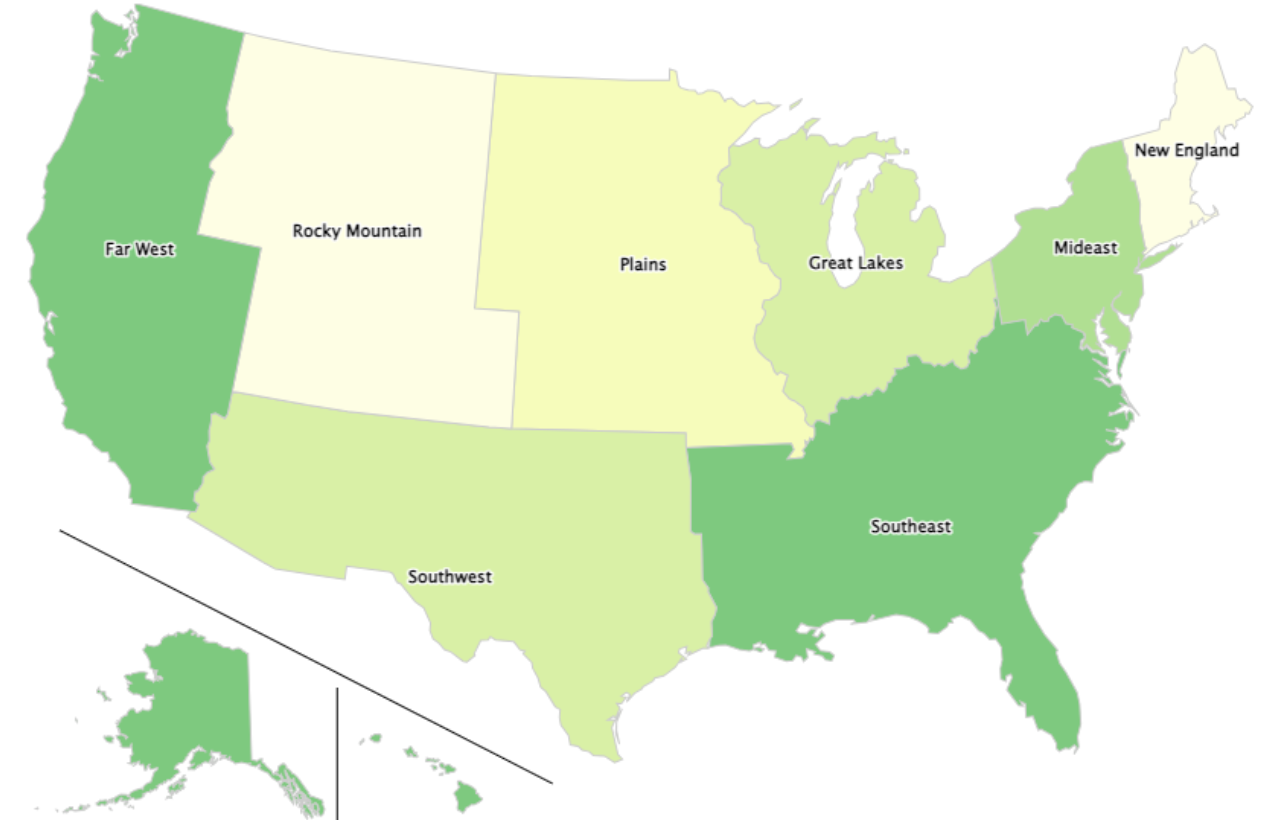
Source: U.S. Bureau of Economic Analysis
The SNII features fourteen indicators patterned on a reduced form of the GII, as pioneered by Cui et al. (2020). These fourteen indicators were constructed using a proxy methodology which assessed to what extent U.S. data sources could approximate the selected GII indicators. The GII and SNII indicator comparison is presented in Figure 2. Data for each adapted indicator was collected per BEA region, tabulated, and then normalized and standardized for use in the below charts.

SNII Summary Results
In Figure 3 below, the results of all fourteen indicators per BEA region are presented in summary form. These results presented in Figure 3 are useful for comparing the relative aggregate indicator scores for each region. Higher overall scores indicate relative strength compared to lower scores; a crucial caveat is that innovative capacity is not fully captured by the results of this analysis. Worth noting is that the data per indicator was normalized to values between 0 and 1, as not all the indicators had the same data range or data type. Min-max normalization means that certain indicators will be absent for the lowest scoring region, as can be seen with the absence of a score for the Far West’s Regulatory Quality indicator. The numerical scores for Figure 3 can be found in Appendix A. For those interested in the non-normalized scores, please see Appendix A.
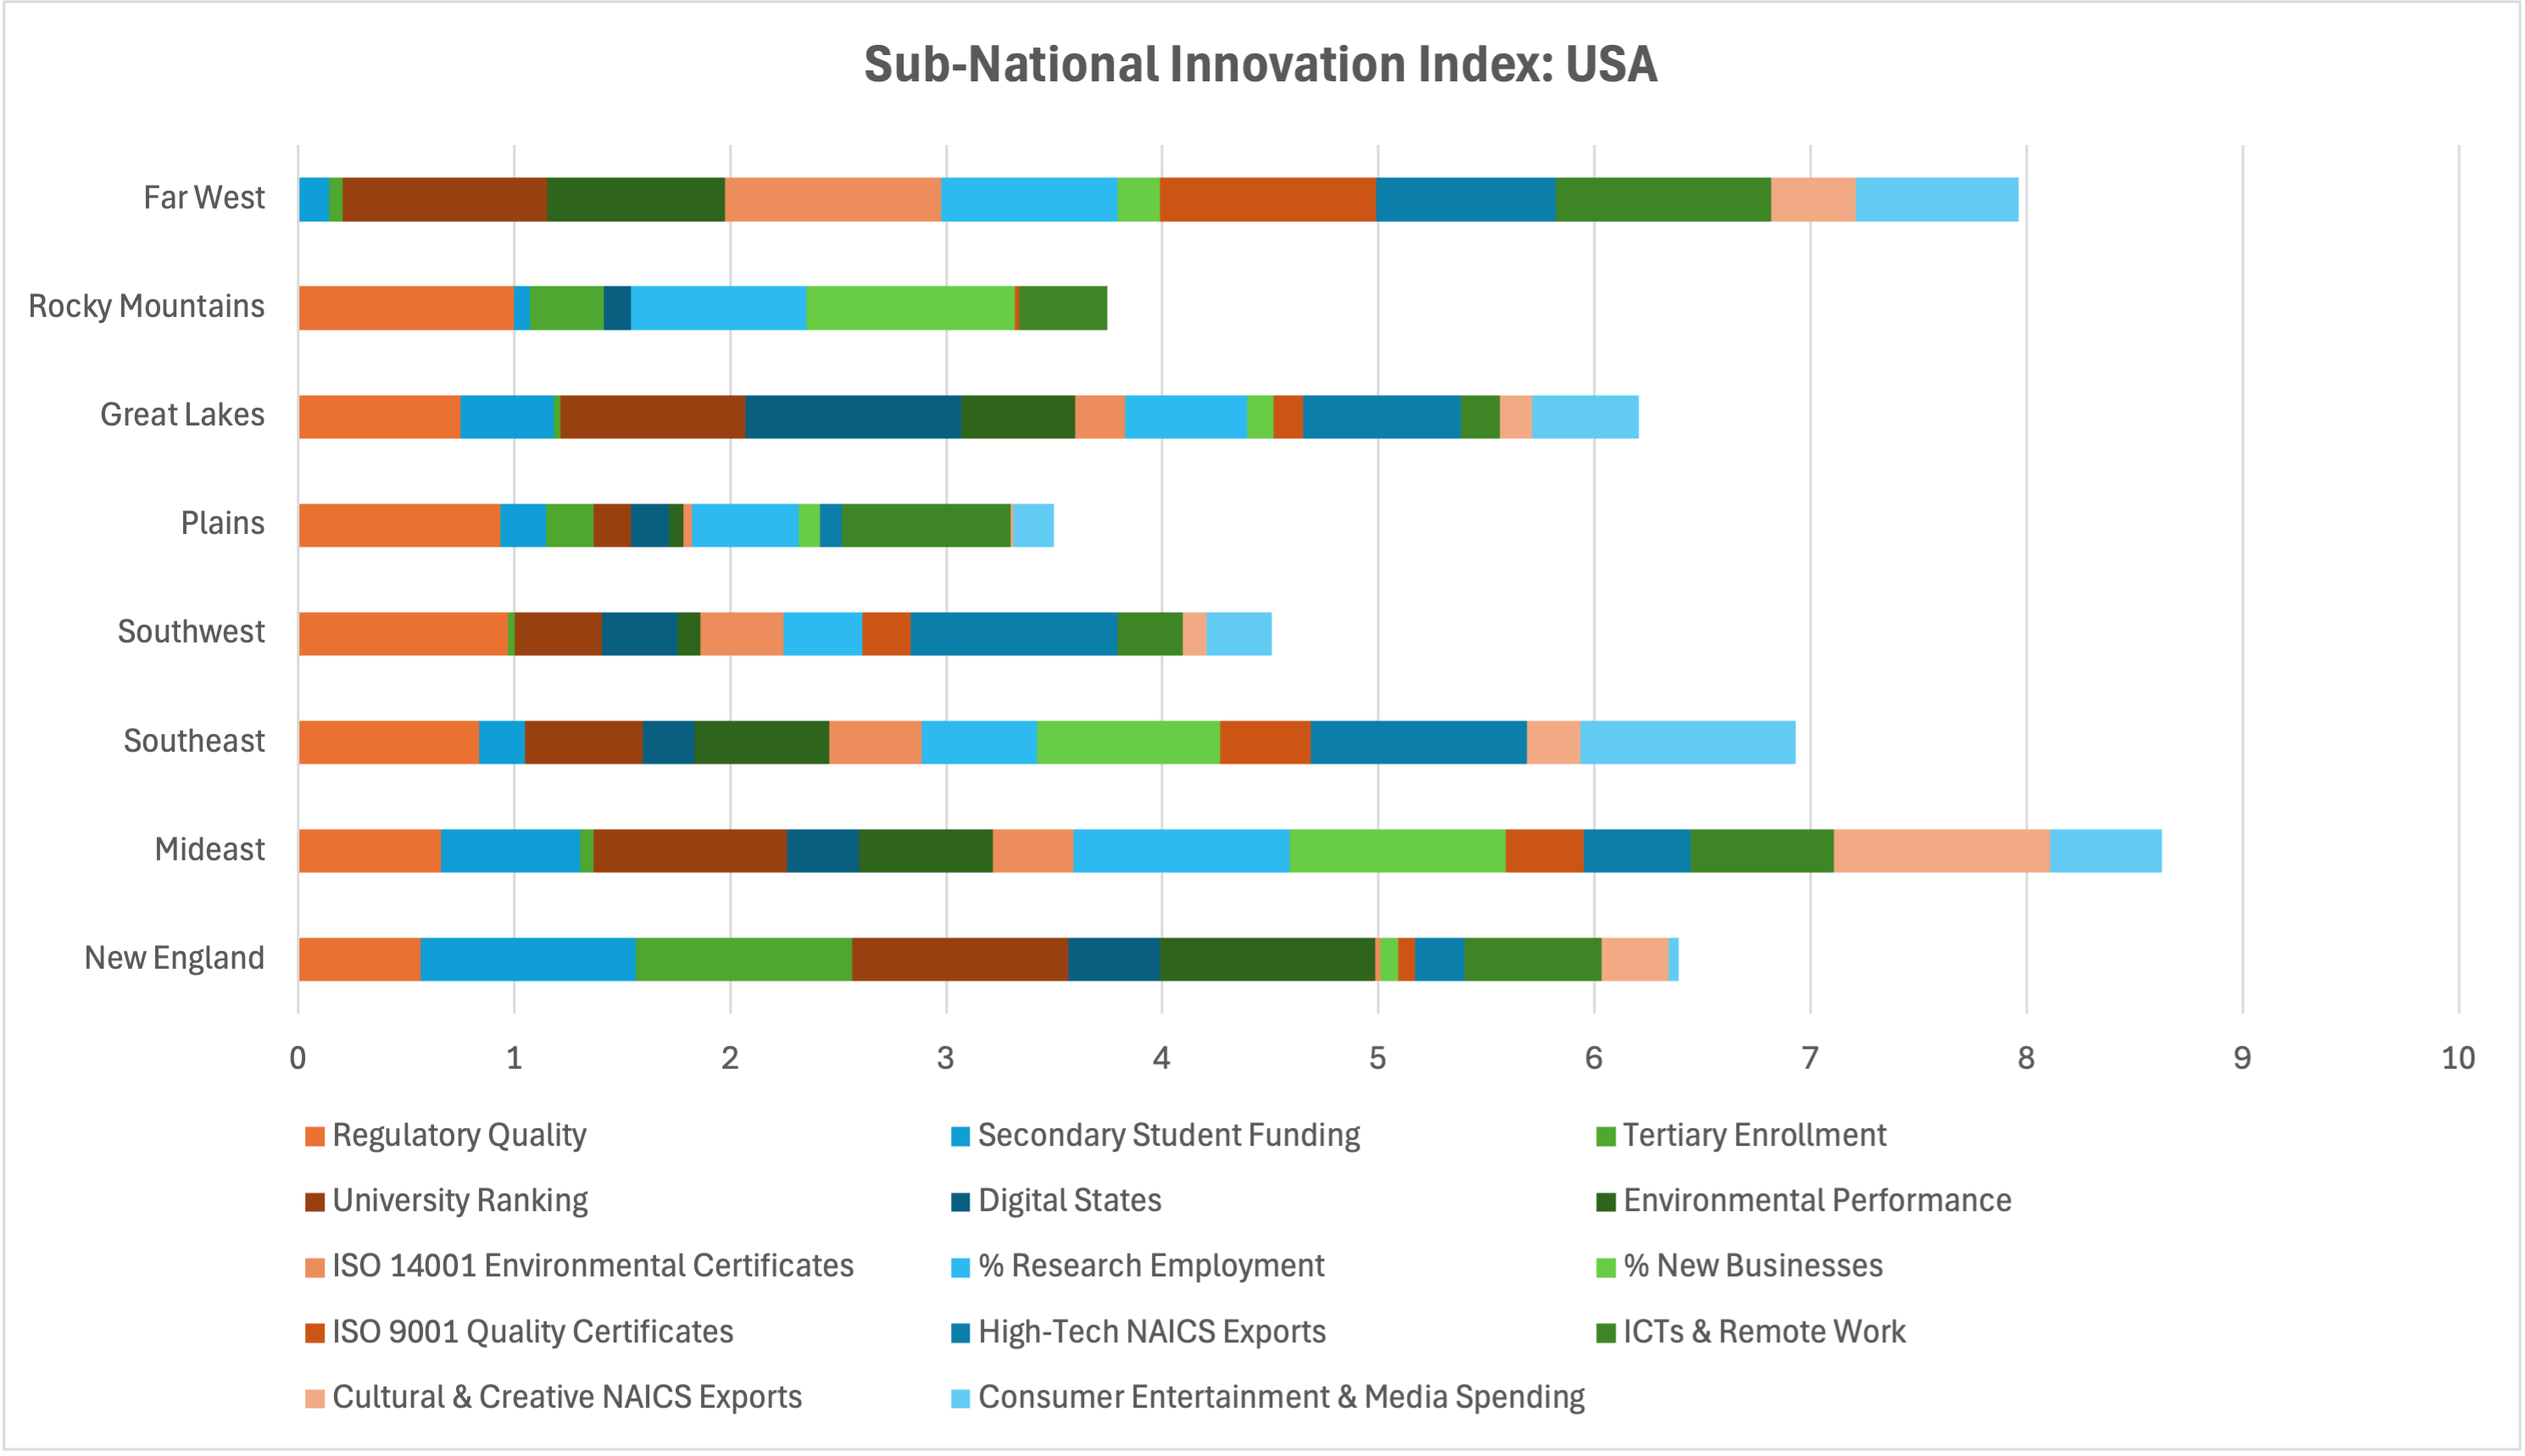
The results in Figure 3 show that, in aggregate, the Mideast and Far West regions are leaders, while the Plains and Rocky Mountain regions are laggards. While this analysis presents aggregate leaders and laggards, it is important to consider how each region ranks across the complete set of indicators. For example, while the Plains is a laggard in overall aggregate indicators, it is a leading region in two indicators: Regulatory Quality and ICTs & Remote Work. This suggests that regions can have varying strengths and weaknesses.
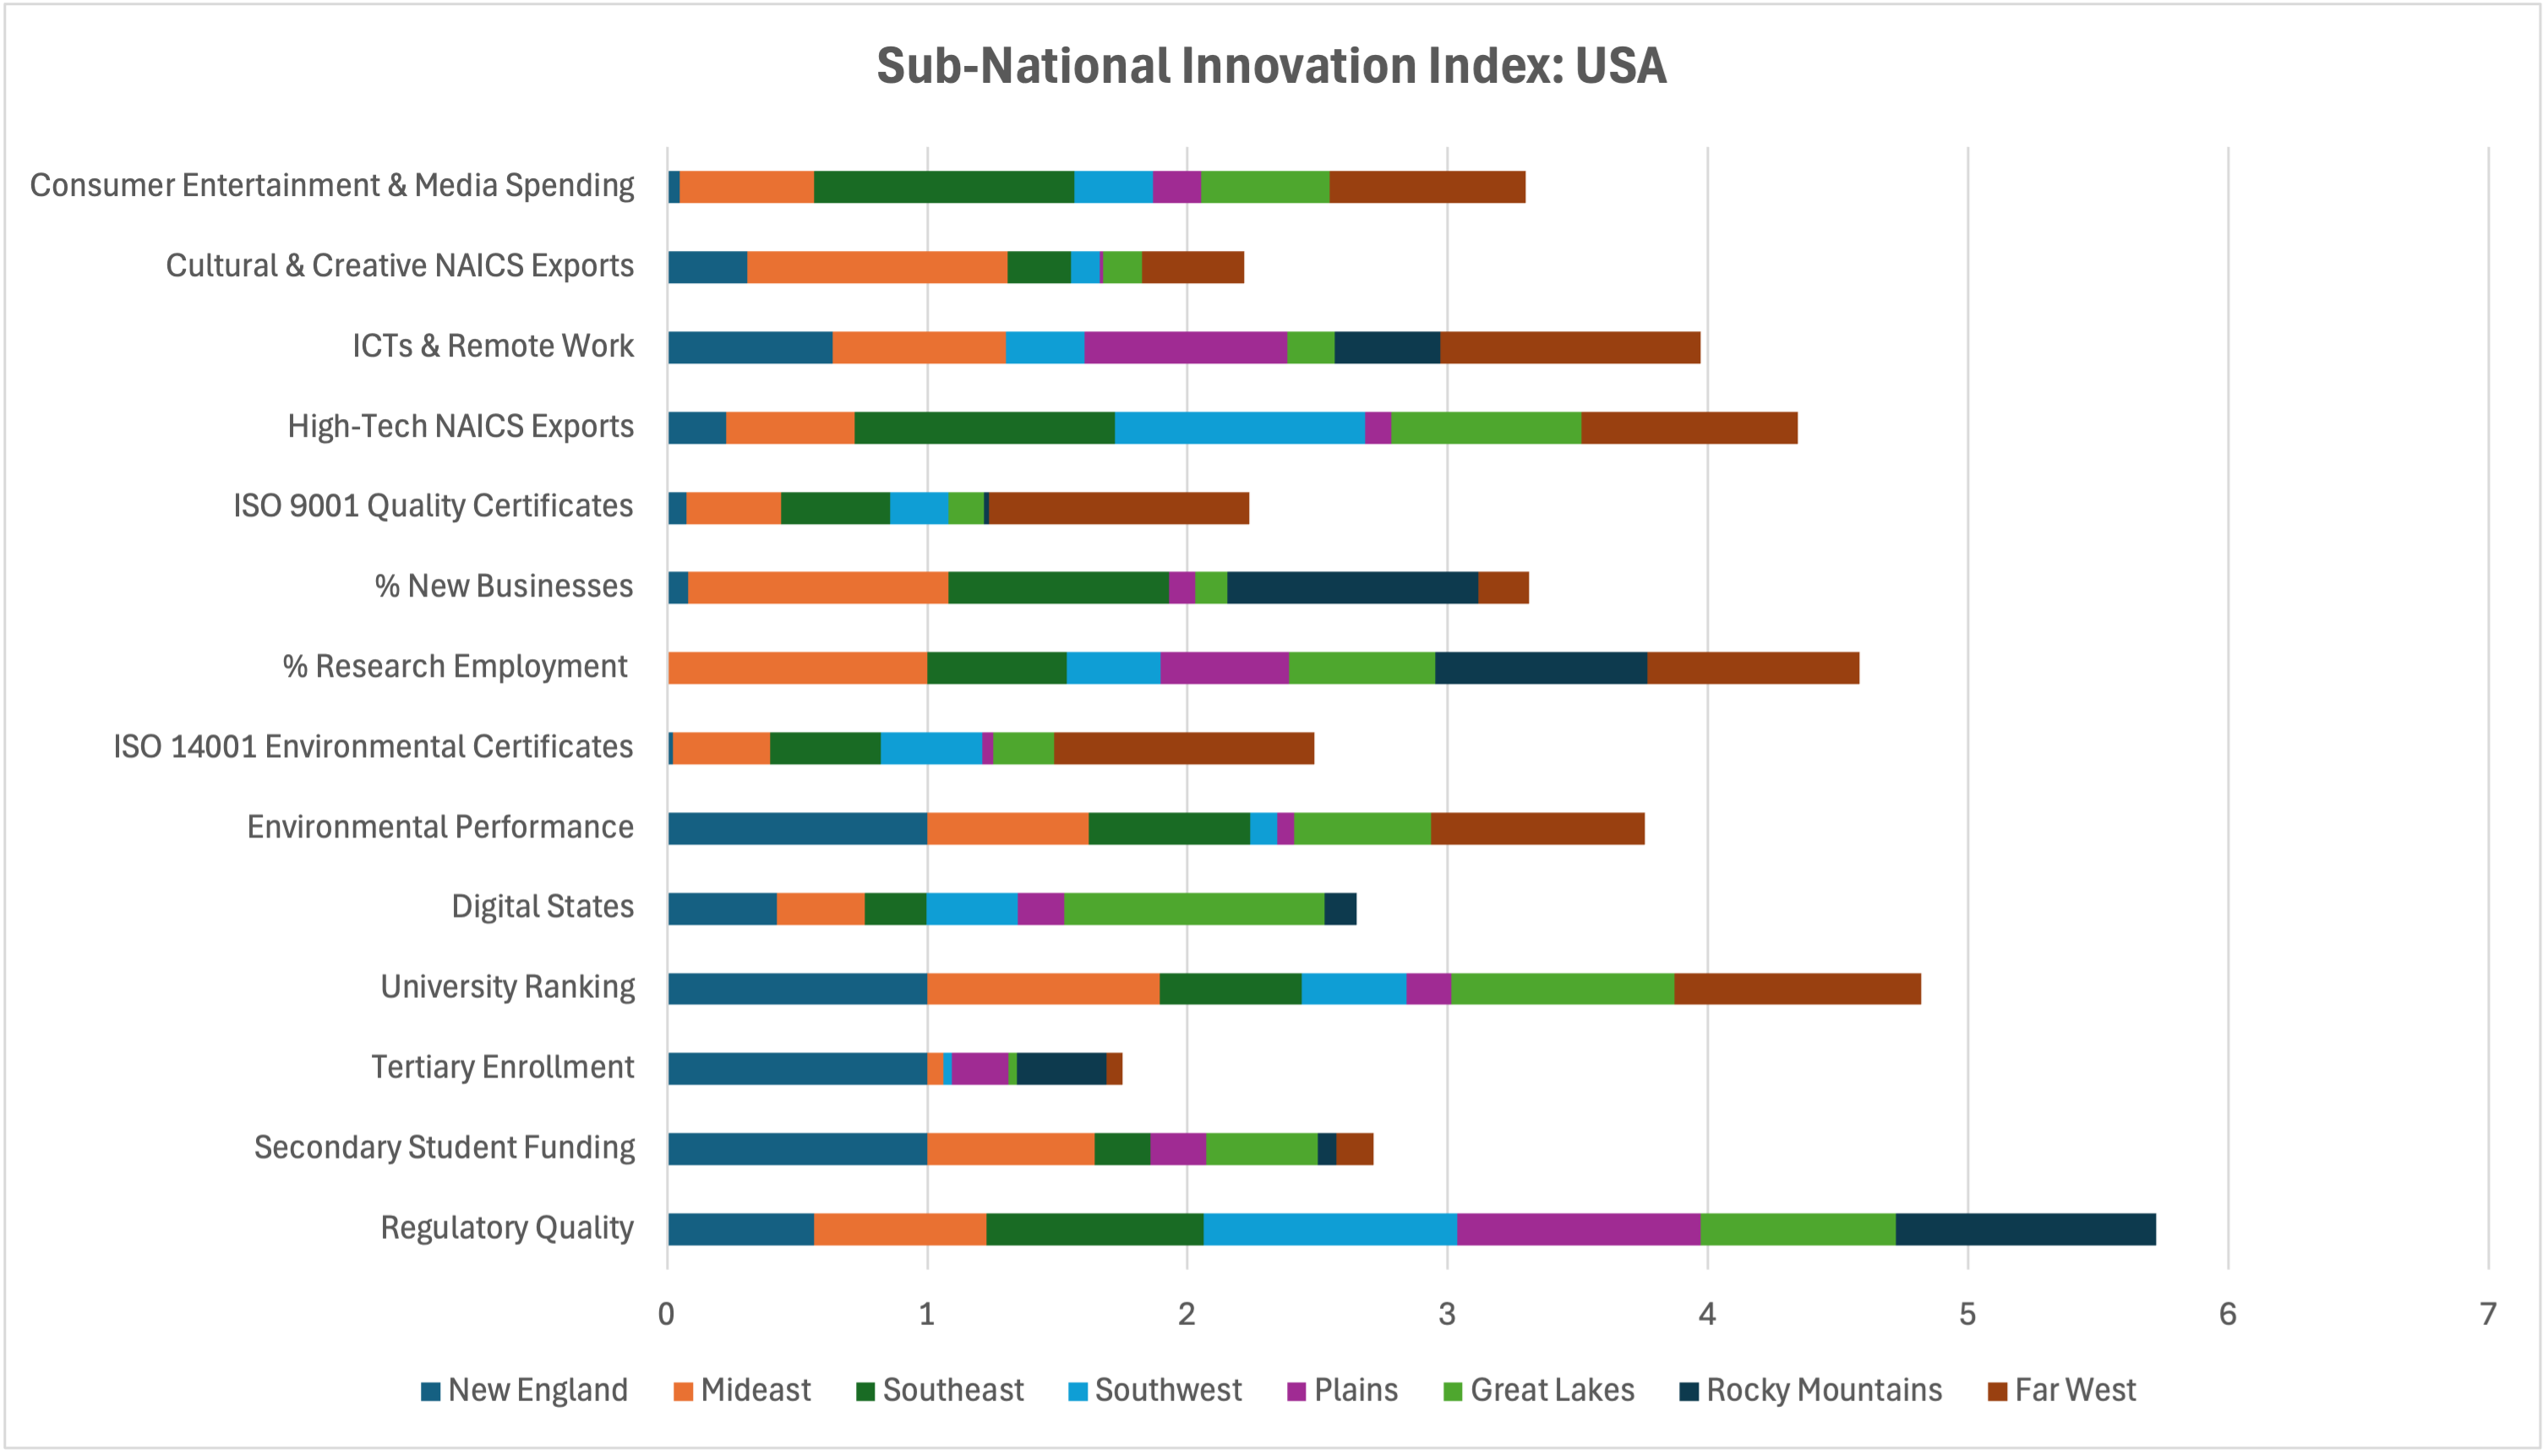
Figure 4, below, presents the normalized scores for each of the fourteen indicators per the eight BEA regions. These results are the same calculations as Figure 3, just tabulated based on indicator instead of region. In Figure 4, one can see the overall aggregate strength of an indicator across all the BEA regions, useful for assessing which indicators are most prominent within the United States. As can be expected, Regulatory Quality, University Ranking, % Research Employment, and High-Tech NAICS Exports are all leading indicators in this study. Lagging indicators include Tertiary Enrollment, ISO 9001 Quality Certificates, and ISO 14001 Environmental Certificates.
The summary results of this section are intended to provide a snapshot of how the eight BEA regions stack up relative to each other across the fourteen dimensions. In the following section, this report will go into additional detail on each of the eight BEA regions.
SNII Results Per BEA Region
Figure 5 shows the standardized scores, grouped by dimension, of the eight BEA regions. Standardization is the process of transforming data to have a mean of zero and a standard deviation of one, which allows for positive and negative values for each region and indicator. Using zero as an average, each region can be assessed relative to the total dataset, both in terms of how well and how poorly a given indicator scores. The numerical scores for Figure 5, along with the remainder of the figures in this section, can be found in Appendix A.
The inclusion of dimensions in Figure 5 was directly inspired by the GII, which contains eighty indicators housed in seven distinct pillars, or dimensions. The SNII, patterned on the GII but distinct given its reduced form and proxied indicators, contains only six dimensions. The Market Sophistication dimension of the GII was not included, as the GII prediction method of Cui et al. (2020) did not make use of any indicator within that dimension.
New England
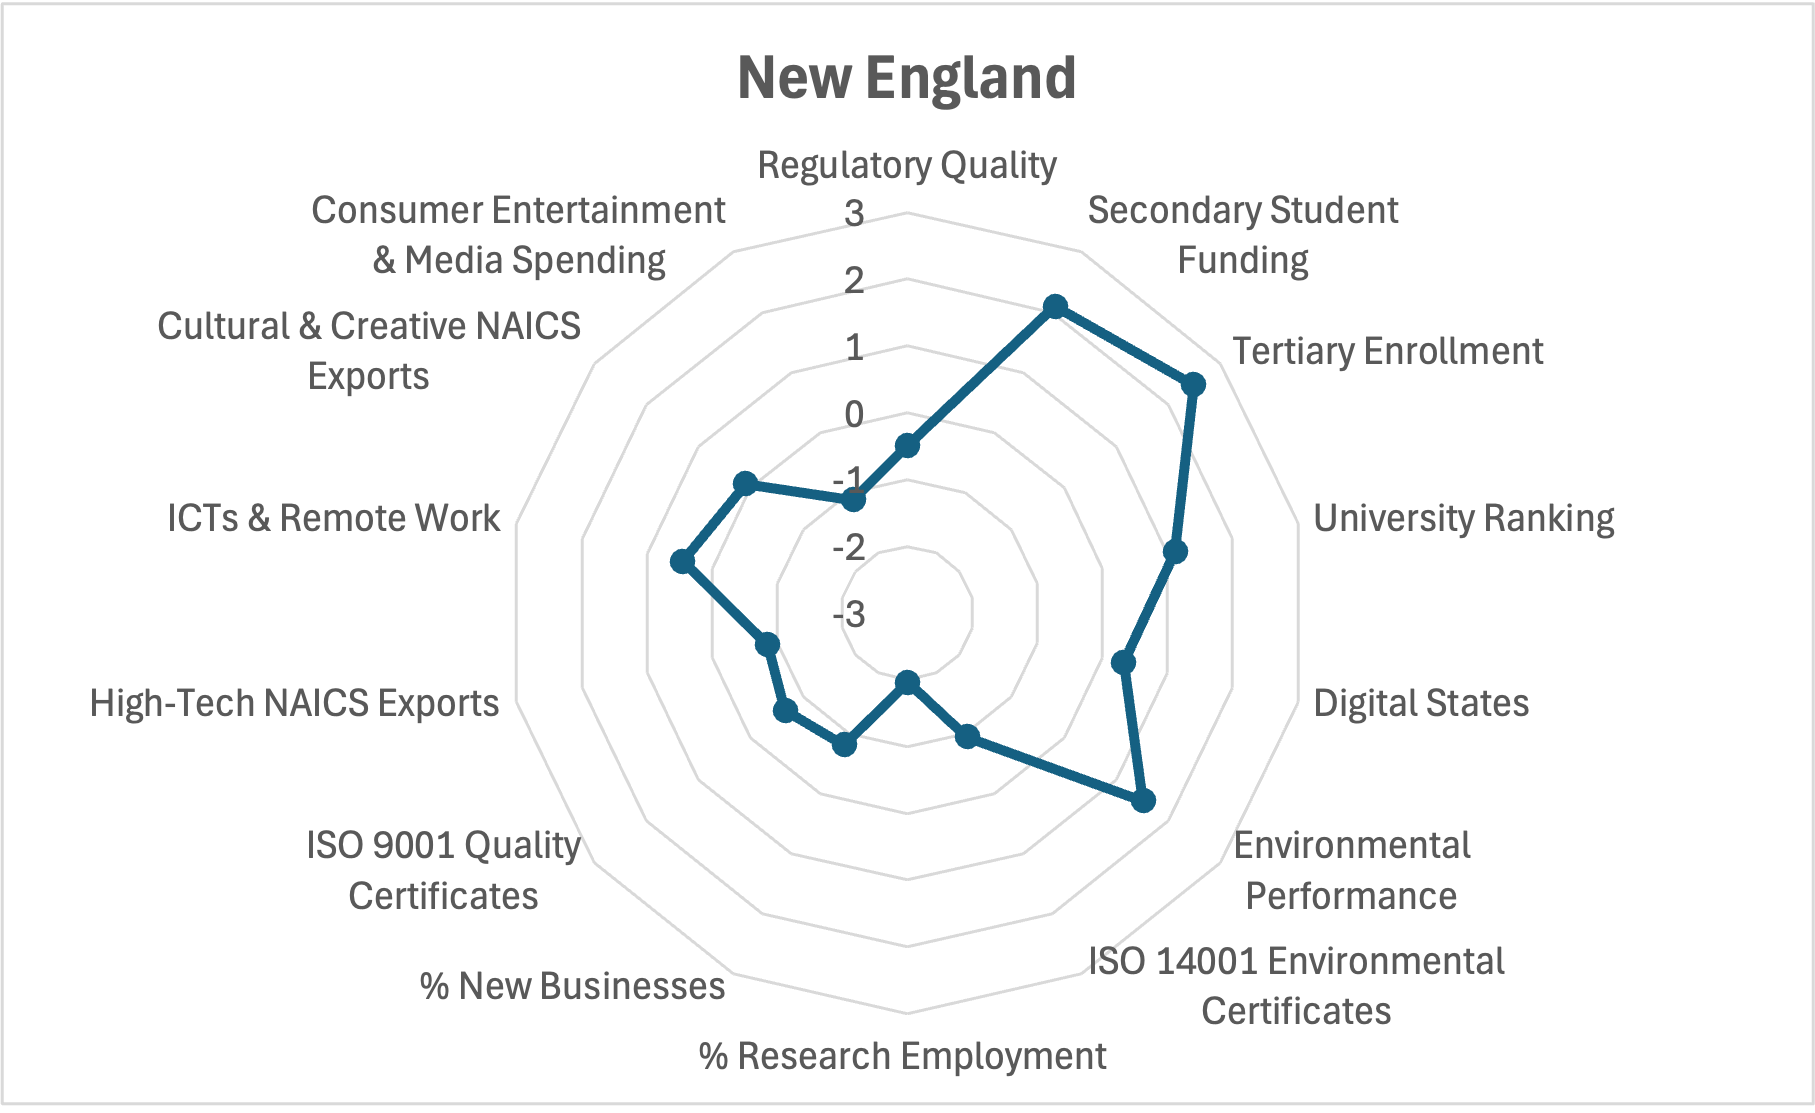
The radar chart in Figure 6 illustrates the standardized scores of the New England region across the fourteen indicators in this study. This visualization highlights strengths in Secondary Student Funding and Tertiary Enrollment, while indicating lower performance in areas such as % Research Employment along with Consumer Entertainment and Media Spending.
Mideast
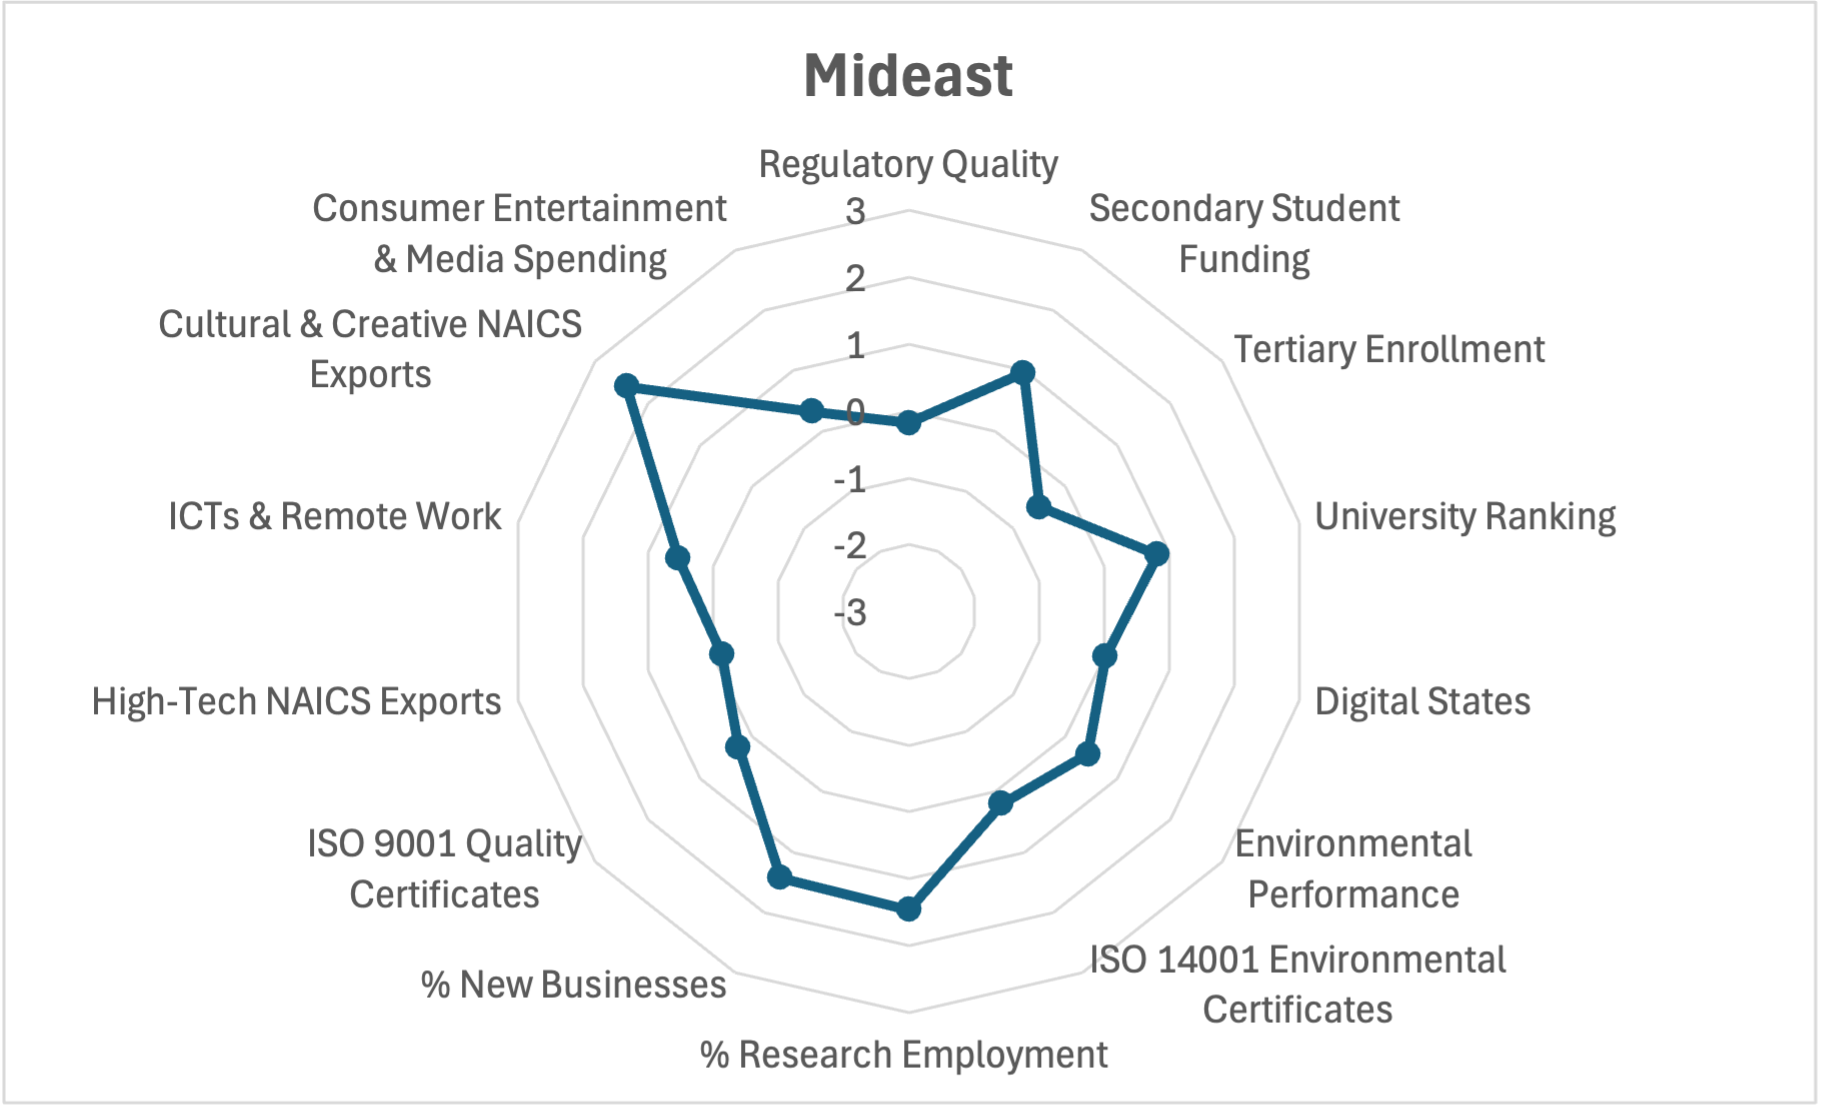
The radar chart in Figure 7 depicts the standardized scores for the Mideast region across the fourteen indicators in this study. This chart highlights the region’s robust performance in Cultural and Creative NAICS Exports, while identifying weaker areas in Tertiary Enrollment and Regulatory Quality.
Southeast
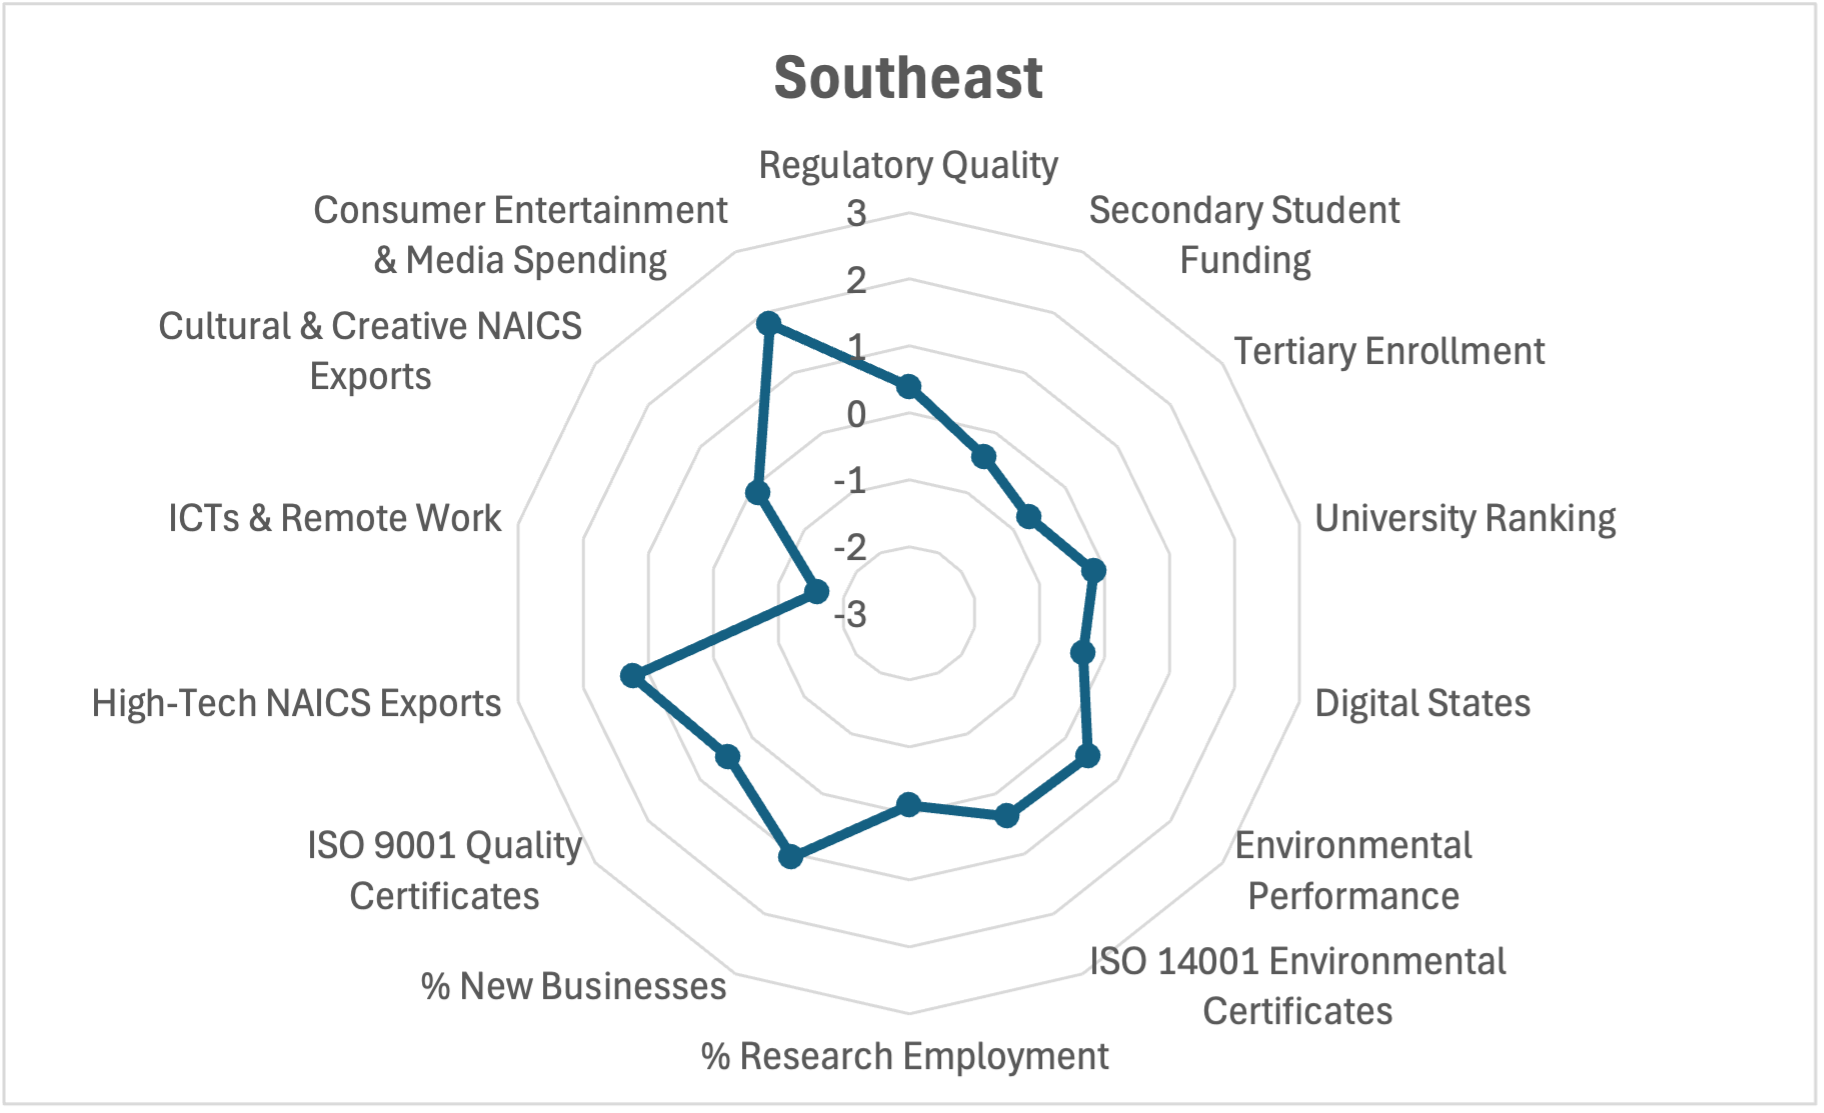
This radar chart presents the standardized performance of the Southeast region across the fourteen indicators in this study (Figure 8). The chart reveals notable strengths in Consumer Entertainment and Media Spending, along with High-Tech NAICS Exports, while showing lower scores in both ICTs & Remote Work and Tertiary Enrollment.
Southwest
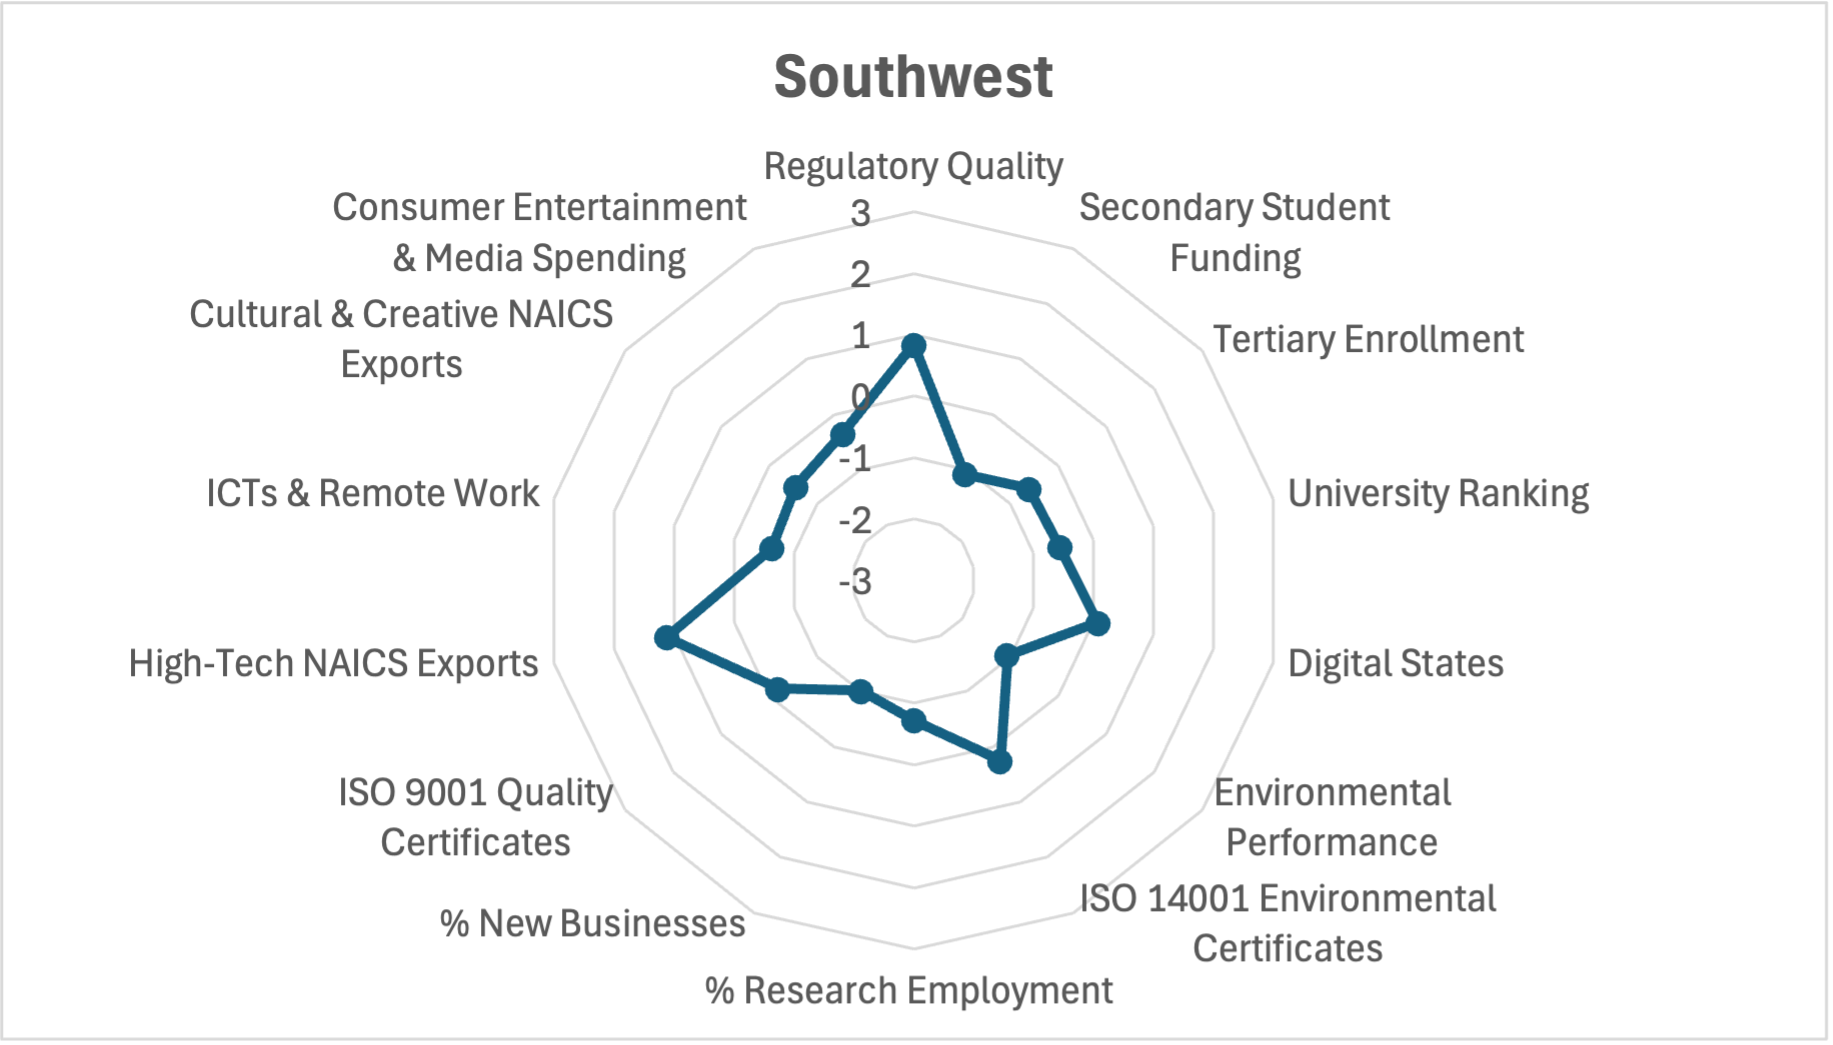
Figure 9’s radar chart highlights the standardized scores for the Southwest region across the fourteen indicators in this study. The data indicates significant strengths in High-Tech NAICS Exports and Regulatory Quality, contrasted by lower scores in % New Businesses and Secondary Student Funding.
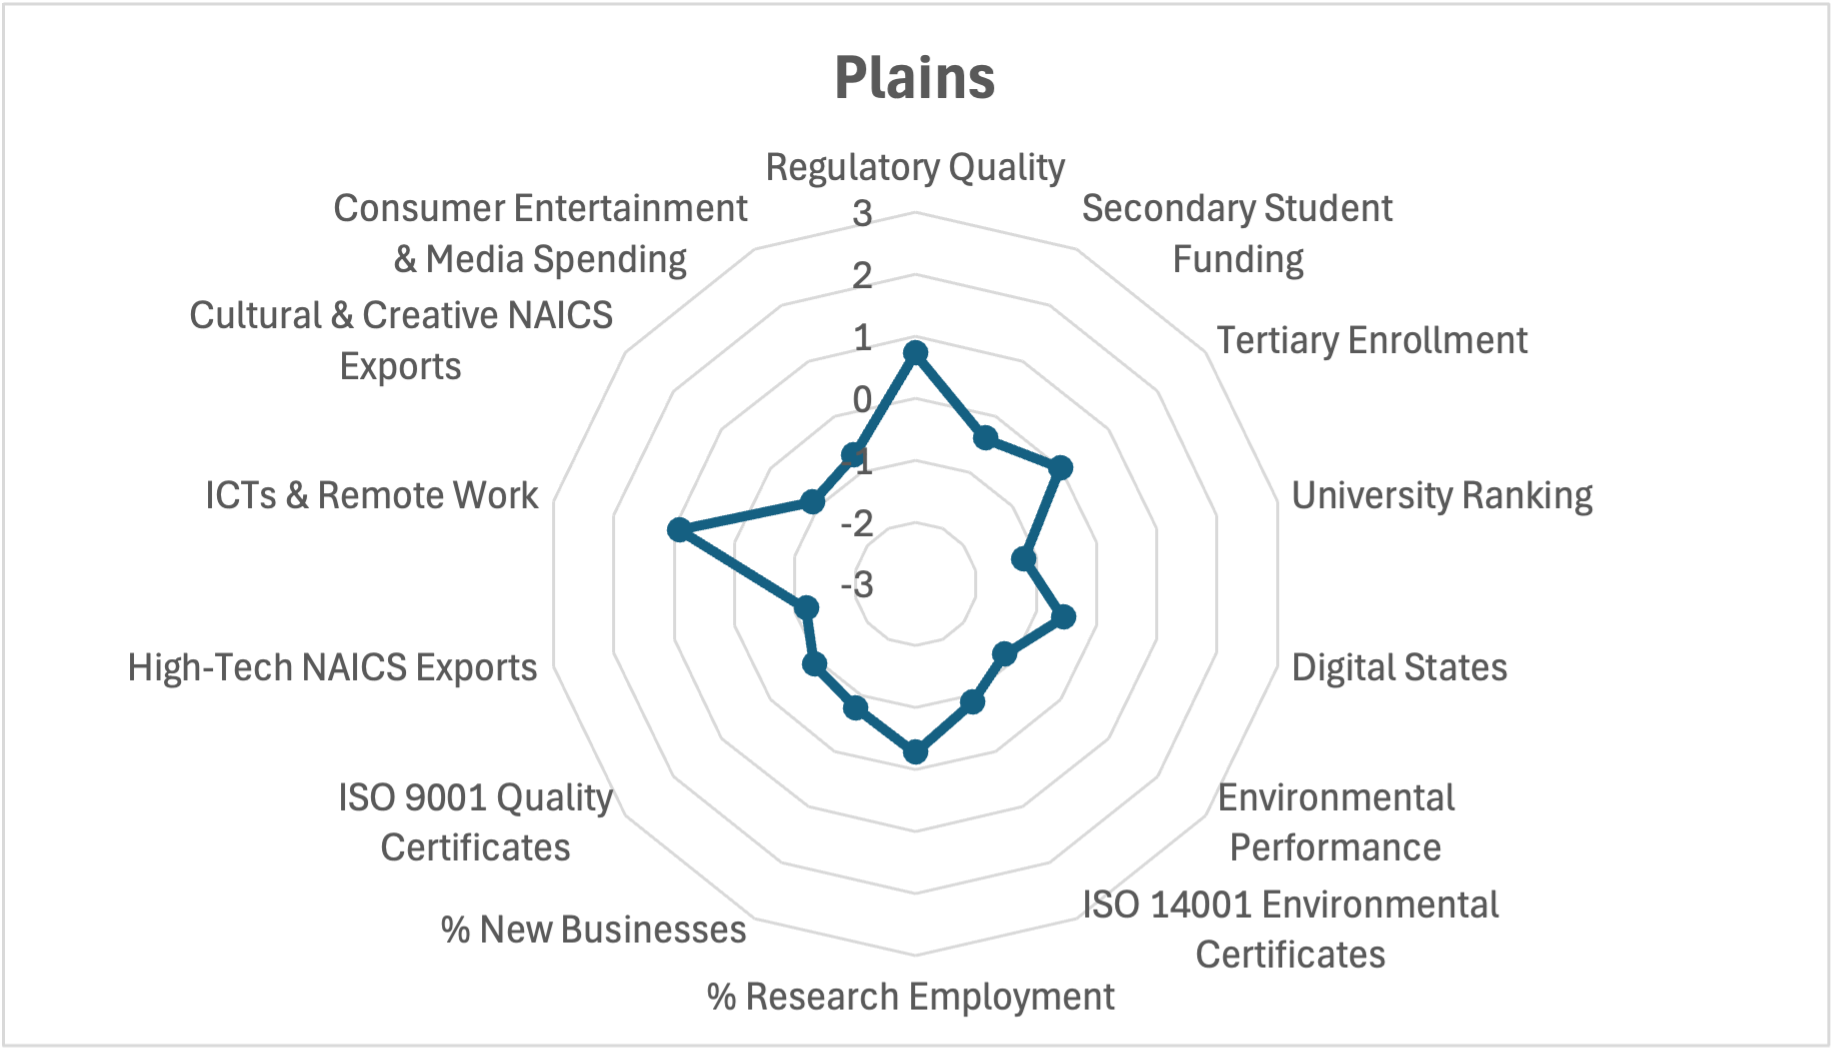
Plains
Figure 10 provides a radar chart of the standardized performance of the Plains region across the fourteen indicators in this study. The chart reveals notable strengths in Regulatory Quality along with ICTs & Remote Work yet has areas for improvement in University Ranking and High-Tech NAICS Exports.
–
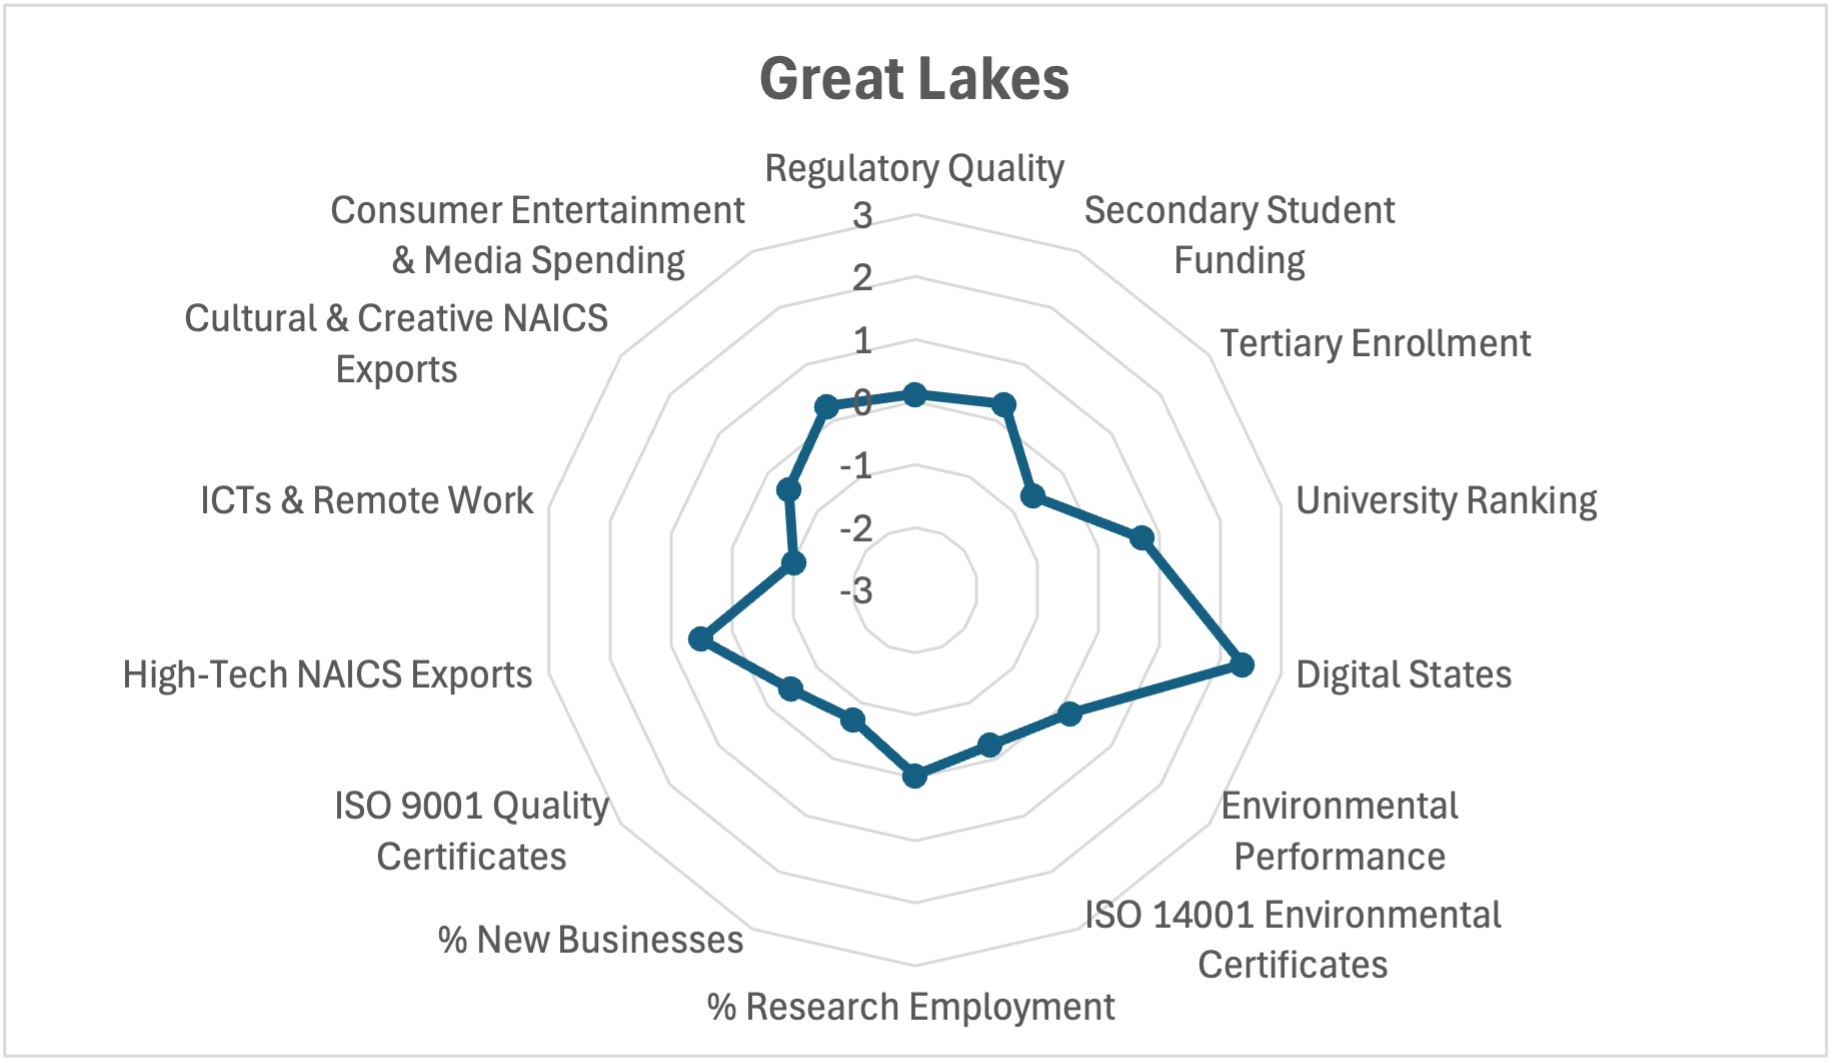
Great Lakes
The radar chart in Figure 11 illustrates the standardized scores for the Great Lakes region across the fourteen indicators in this study. The region demonstrates strong performance in Digital States and University Ranking, while showing lower scores in ICTs & Remote Work, along with % New Businesses.
–
Rocky Mountains
This radar chart presents the standardized performance of the Rocky Mountains region across the fourteen indicators in this study (Figure 12). The chart highlights the region’s strong performance in % New Businesses and Regulatory Quality, while indicating areas for improvement in University Ranking and High-Tech NAICS Exports.

–
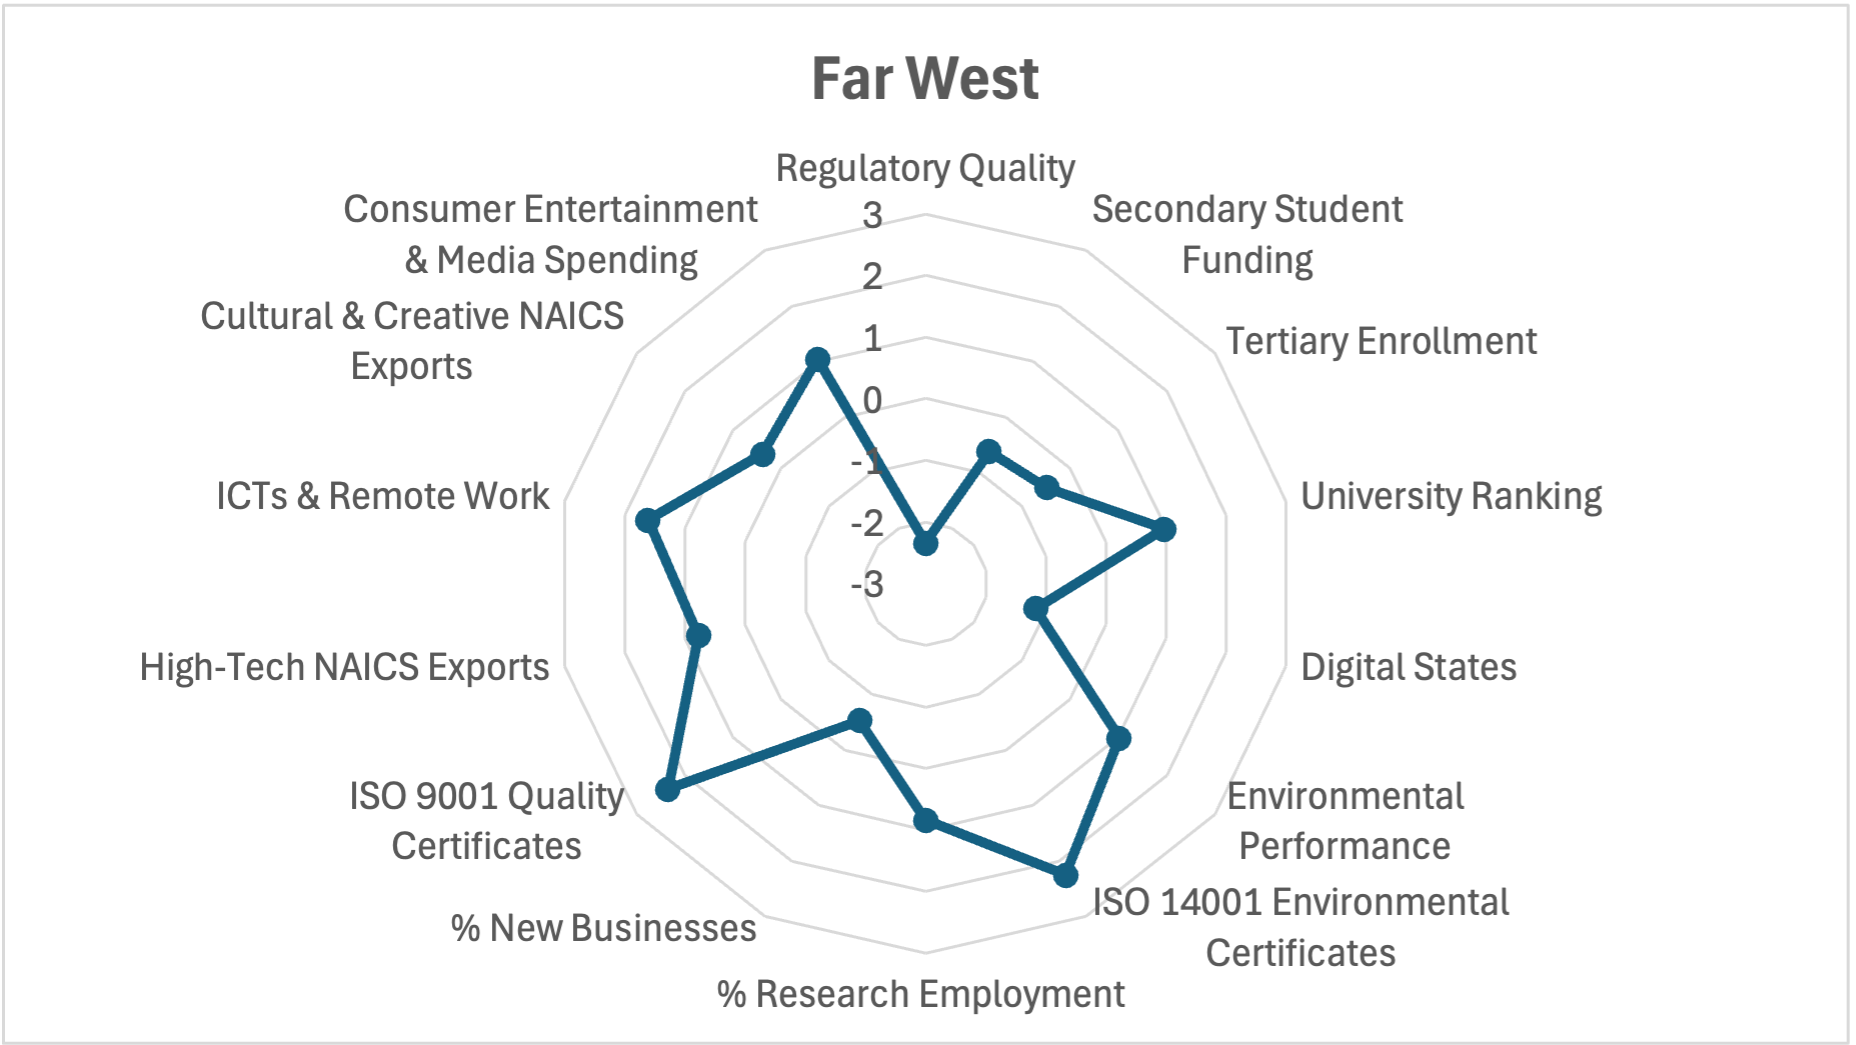
Far West
The radar chart in Figure 13 depicts the standardized scores for the Far West region across the fourteen indicators in this study. This visualization highlights strengths in ISO 9001 Quality Certificates and ISO 14001 Environmental Certificates, while identifying weaker performance in Regulatory Quality and Digital States.
–
Discussion
The overall aim of this study was to design a prototype sub-national innovation index informed by the GII and tailored to the data within the United States. This study has successfully designed a proxy methodology for creating indicators at the sub-national level for the U.S. and demonstrated the results of these proxied indicators per BEA region. Importantly, the results presented in this study should be considered provisional. Ideally, a follow-up study would expand on the initial results of this study to design a more robust U.S. SNII. Below is a brief discussion of what this expanded study could look like and how it might be structured.
Based on the lessons learned from this work, a follow-up project would want to address three important points. The first would be to determine the most relevant grouping of states for the regions used. While the BEA region grouping was selected for this study, it might be neither the most relevant nor most methodologically sound way to delimit the geographic regions of the United States. Determining how states should be grouped into regions should also address why multi-state regions are used over single states, especially given differences in state functioning and the relatively limited capabilities of regional entities in the U.S. system.
This first point could be informed by the intended audience of the SNII, a crucial second point to consider. The audiences for a future SNII could be state-level decision-makers, national policymakers focused on state and regional innovation, government agencies with a regional focus and emphasis on innovation (e.g., the BEA, Department of Energy national labs), state-level agencies (e.g., Chambers of Commerce), regional academic coalitions, or private-sector start-up incubators. Audience selection would likely be informed by analysis of past and current legislation enacted to drive innovation at the regional level, such as the Regional Technology and Innovation Hubs program, part of the CHIPS and Science Act of 2022.
Point three for a more in-depth SNII would be a focus on the methodology: both in assessing the data sources used and the validity of indicator proxies. This study used a range of data sources, some of which might not be appropriate for a future study that could be structured for more than one year. A follow-up study could consider different data sources or even the creation of one or more new data sources. Finally, a future study would want to assess the validity of a given indicator proxy, which could include a sensitivity analysis. To summarize, a future SNII would want to justify the regional formulation, articulate who the target audience is, and develop a more refined methodology.
About the Global Innovation Index (GII)
Published annually, the core of the GII provides performance measures and ranks 132 economies on their innovation ecosystems. The Index is built on a rich dataset – the collection of 81 indicators from international public and private sources – going beyond the traditional measures of innovation since the definition of innovation has broadened.
For ongoing work on assisting countries to measure and improve innovation at the sub-national level see the WIPO toolkit on “Enabling Innovation Measurement at the Sub-National Level” and the dedicated WIPO General Assemblies Side Event. In addition, the GII identifies the world’s top 100 science and technology clusters.
Courtney Bower is a Ph.D. Candidate in Regional Science at Cornell University and a Senior Fellow at the Portulans Institute. His dissertation research focuses on the economic impacts of transitions to circular and hydrogen economies from a regional innovation systems perspective.


